SELECTION OF A SUBSET OF POINTS WITH THE POINTCLOUD CLASS
This tutorial presents different strategies for the selection of point subsets . These examples are taken from the help text of the method select, see help pointCloud.select.
Contents
- (1) RandomSampling = Random sampling of a percentage of points
- (2) IntervalSampling = Select each n-th point based upon ordering of points in obj.X
- (3) UniformSampling = Uniform sampling of points in space
- (4) MaxLeverageSampling = Selection of points based on their 'leverages'
- (5) NormalSampling = Selection of points based on the normal vector
- (6) Attribute = Selection of points based on an attribute
- (7) Limits = Selection of points within a selection window
- (8) InPolygon = Selection of points inside of a 2d polygonal region
- (9) InVoxelHull = Selection of points inside of a specified voxel hull
- (10) RangeSearch = Selection of points within the range of another point cloud
- (11) KnnSearch = Selection of K nearest neighbors for each point of another point cloud
- (12) Profile = Selection of points within a vertical profile
Note: You can extract the code from this html file with the matlab function grabcode
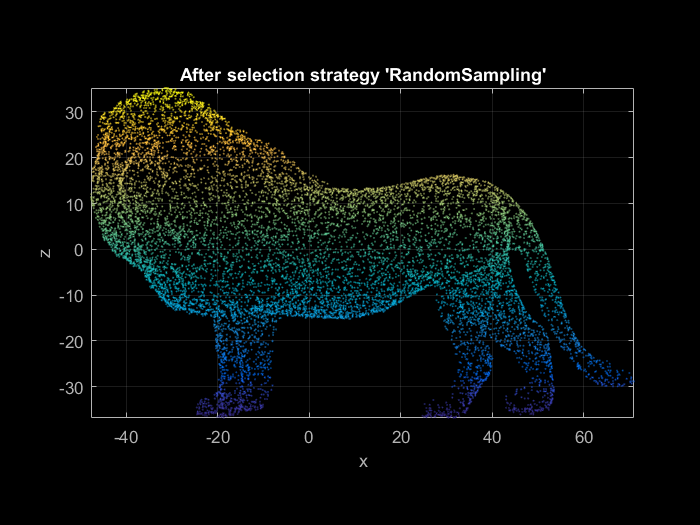
(1) RandomSampling = Random sampling of a percentage of points
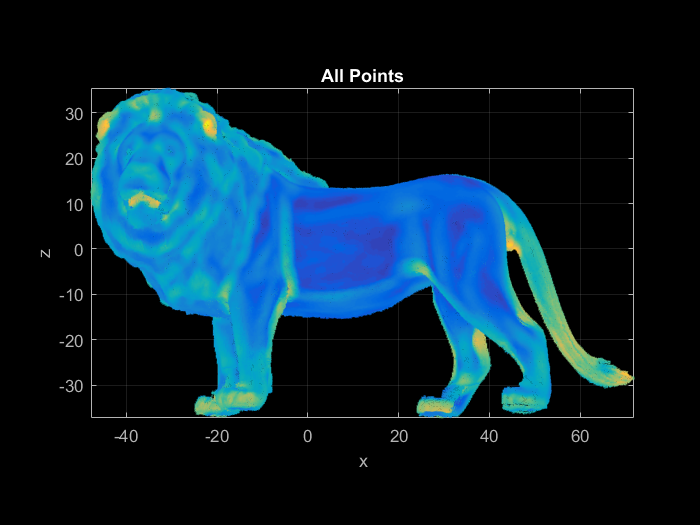
clc; clear; close all; % clear everything

% Import point cloud
pc = pointCloud('Lion.xyz');

% Plot all points
pc.plot; % points are colored by z coordinate
title('All Points', 'Color', 'w'); view(0,0); snapnow;

% Select randomly 5 percent of all points
pc.select('RandomSampling', 5);

% Plot only selected points
close; pc.plot;
title('After selection strategy ''RandomSampling''', 'Color', 'w'); view(0,0);

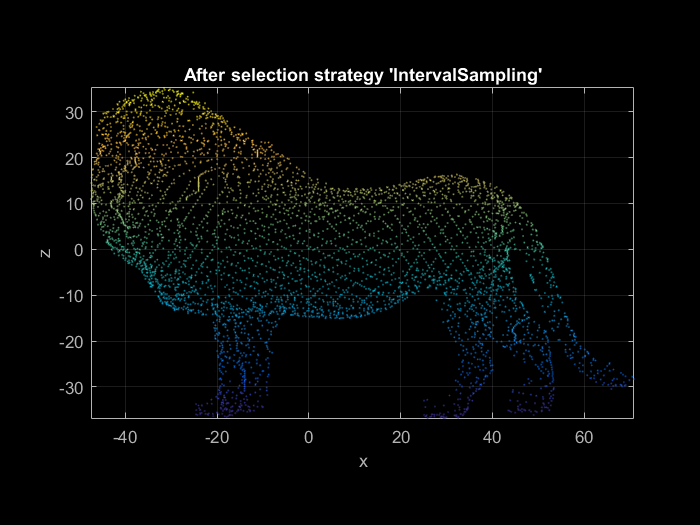
(2) IntervalSampling = Select each n-th point based upon ordering of points in obj.X
clc; clear; close all; % clear everything

% Import point cloud
pc = pointCloud('Lion.xyz');

% Plot all points
pc.plot;
title('All Points', 'Color', 'w'); view(0,0); snapnow;

% Select each 50-th point
pc.select('IntervalSampling', 50);

% Plot only selected points
close; pc.plot;
title('After selection strategy ''IntervalSampling''', 'Color', 'w'); view(0,0);

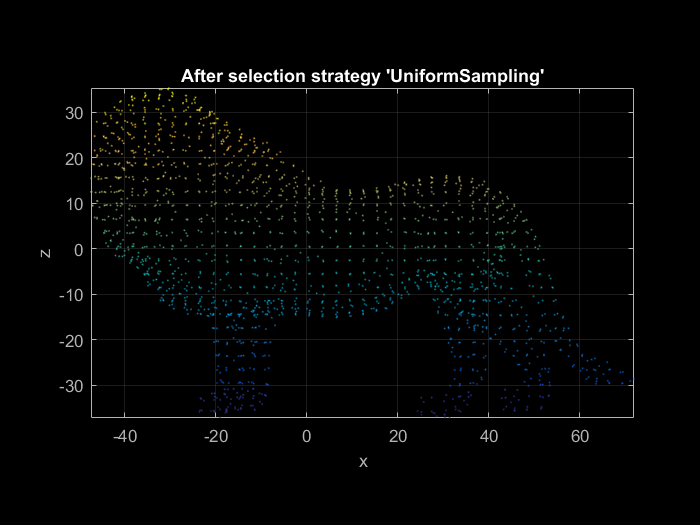
(3) UniformSampling = Uniform sampling of points in space
This strategy gives a homogeneous distribution of the selected points. For this a voxel structure is derived from the point cloud and the points closest to each voxel center are selected. Consequently, the mean sampling distance corresponds to the edge length of the voxels.
clc; clear; close all; % clear everything

% Import point cloud
pc = pointCloud('Lion.xyz');

% Plot all points
pc.plot;
title('All Points', 'Color', 'w'); view(0,0); snapnow;

% Select points using a voxelSize of 3
pc.select('UniformSampling', 3);

% Plot only selected points
close; pc.plot;
title('After selection strategy ''UniformSampling''', 'Color', 'w'); view(0,0);

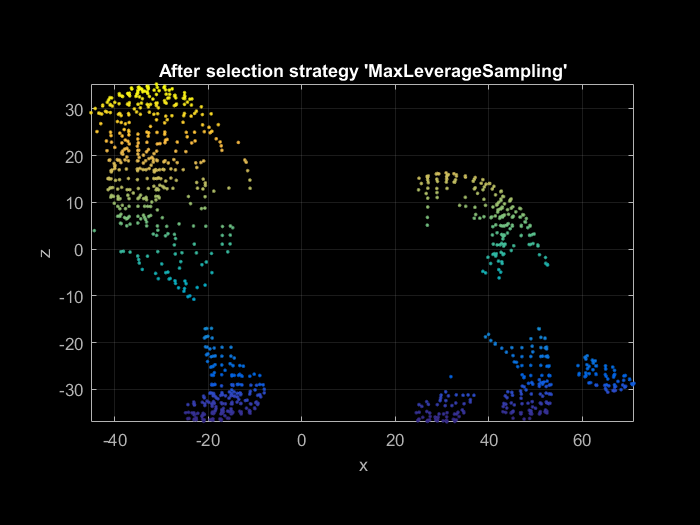
(4) MaxLeverageSampling = Selection of points based on their 'leverages'
This special selection strategy is only relevant if points are used for the estimation of transformation parameters (e.g. for the Iterative Closest Point algorithm). The normal vectors are required for this option.
clc; clear; close all; % clear everything

% Import point cloud
pc = pointCloud('Lion.xyz');

% Plot all points
pc.plot;
title('All Points', 'Color', 'w'); view(0,0); snapnow;

% First, let's select a subset of points with the UniformSampling strategy
pc.select('UniformSampling', 2);

% Calculate the normals of the selected points with a searchRadius of 1
pc.normals(1);

% Now, select 25 percent of the points with the MaxLeverageSampling strategy
pc.select('MaxLeverageSampling', 25);

% Plot only selected points
close; pc.plot('MarkerSize', 5);
title('After selection strategy ''MaxLeverageSampling''', 'Color', 'w'); view(0,0);

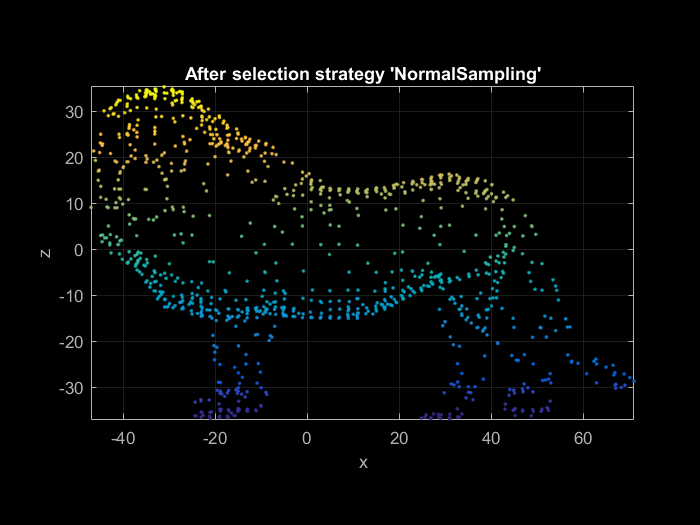
(5) NormalSampling = Selection of points based on the normal vector
The aim of this strategy is to select points such that the distribution of their normals in angular space is as large as possible. For this the angular space (exposition=x vs. slope=y) is divided into classes of equal angular extension (e.g. 10°×10°), and points are uniformly sampled among these classes. The normal vectors are required for this option.
clc; clear; close all; % clear everything

% Import point cloud
pc = pointCloud('Lion.xyz');

% Plot all points
pc.plot;
title('All Points', 'Color', 'w'); view(0,0); snapnow;

% First, let's select a subset of points with the UniformSampling strategy
pc.select('UniformSampling', 2);

% Calculate the normals of the selected points with a search radius of 1
pc.normals(1);

% Now, select 25 percent of the points with the NormalSampling strategy
pc.select('NormalSampling', 25);

% Plot only selected points
close; pc.plot('MarkerSize', 5);
title('After selection strategy ''NormalSampling''', 'Color', 'w'); view(0,0);

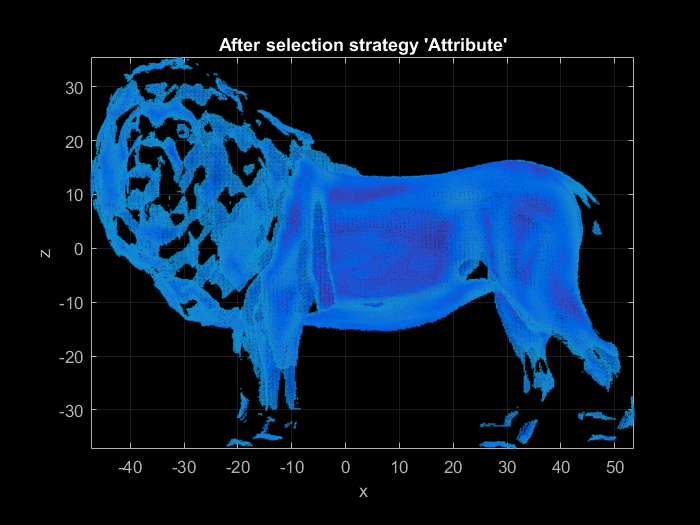
(6) Attribute = Selection of points based on an attribute
The attribute has to be a field of the structure obj.A, e.g. obj.A.roughness.
clc; clear; close all; % clear everything

% Import point cloud WITH attributes (nx, ny, nz are the components of the normal vector)
pc = pointCloud('Lion.xyz', 'Attributes', {'nx' 'ny' 'nz' 'roughness'});
Note: the imported attributes are saved now as fields in the structure pc.A, e.g. the roughness in saved in pc.A.roughness.
% Plot all points
pc.plot('Color', 'A.roughness', 'CAxisLim', [0 1]); % colored by roughness; range of color bar from 0 to 1
title('All Points', 'Color', 'w'); view(0,0); snapnow;

% Select points with roughness in the specified range; in doing so, only the smooth parts of the point cloud are selected
roughnessRange = [0.01 0.3];
pc.select('Attribute', 'roughness', roughnessRange);

% Plot only selected points
close; pc.plot('Color', 'A.roughness', 'CAxisLim', [0 1]);
title('After selection strategy ''Attribute''', 'Color', 'w'); view(0,0);
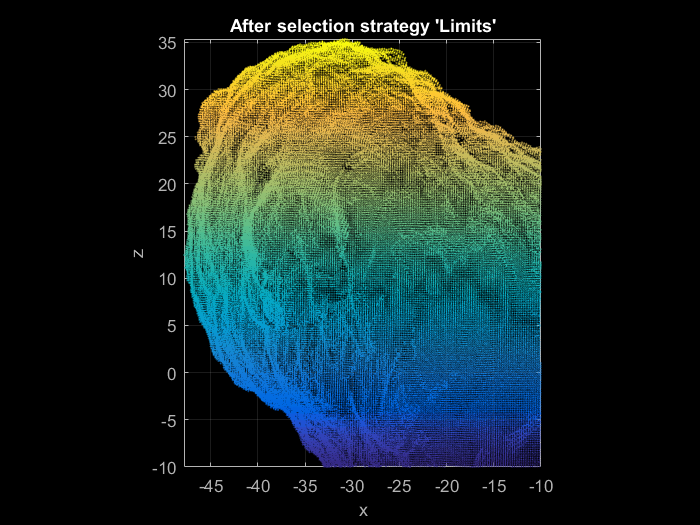
(7) Limits = Selection of points within a selection window
clc; clear; close all; % clear everything

% Import point cloud
pc = pointCloud('Lion.xyz');

% Plot all points
pc.plot;
title('All Points', 'Color', 'w'); view(0,0); snapnow;

% Selection of the lions head
limitsMinMax = [-Inf -10
                 -30  20
                 -10 Inf];

pc.select('Limits', limitsMinMax);

% Plot only selected points
close; pc.plot;
title('After selection strategy ''Limits''', 'Color', 'w'); view(0,0);

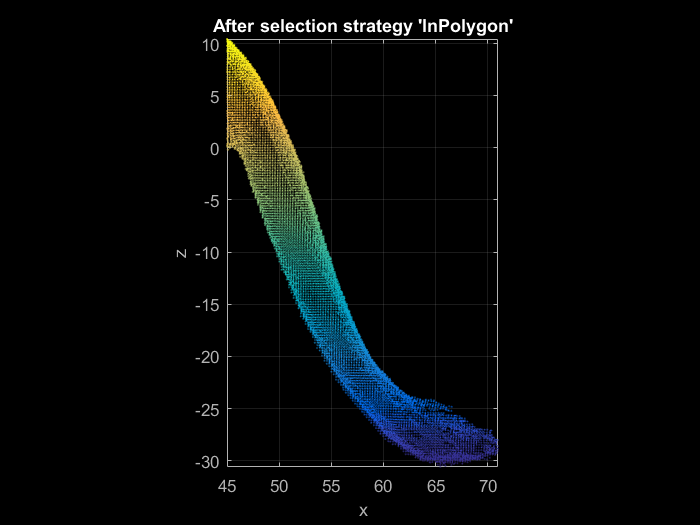
(8) InPolygon = Selection of points inside of a 2d polygonal region
clc; clear; close all; % clear everything

% Import point cloud
pc = pointCloud('Lion.xyz');

% Plot all points
pc.plot;
title('All Points', 'Color', 'w'); view(0,0); snapnow;

% Selection of the lions tail within the specified polygon
polygon = [45  4
           45 -7
           56 -7
           71 -2
           71  4
           63  6];

pc.select('InPolygon', polygon);

% Plot only selected points
close; pc.plot;
title('After selection strategy ''InPolygon''', 'Color', 'w'); view(0,0);

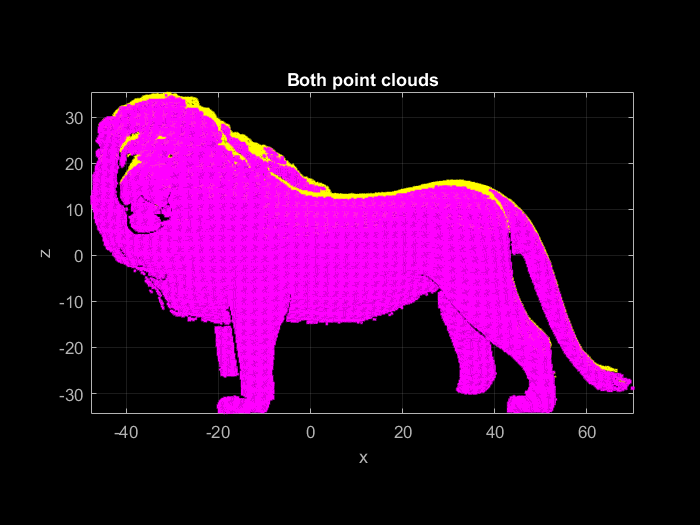
(9) InVoxelHull = Selection of points inside of a specified voxel hull
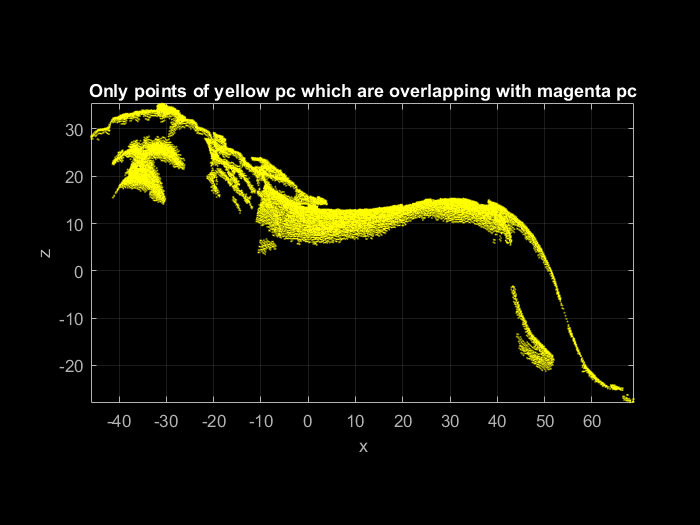
This method can be used to select points in parts which are common to another point cloud , i.e. in the overlapping areas of two point clouds.
In this example two point clouds are given. Those points of the second point cloud are selected, which are overlapping to the first point cloud.
clc; clear; close all; % clear everything

% Import the two point clouds
pcScan1 = pointCloud('LionScan1.xyz');
pcScan2 = pointCloud('LionScan2.xyz');

% Plot them in different colors
pcScan1.plot('Color', 'm'); % magenta
pcScan2.plot('Color', 'y'); % yellow
title('Both point clouds', 'Color', 'w'); view(0,0); snapnow;

% Select points of second point cloud which are inside of the voxel hull of the first point cloud
voxelSize = 2;
pcScan1.getVoxelHull(voxelSize); % get voxel hull of first point cloud

pcScan2.select('InVoxelHull', pcScan1.voxelHull, ...
                              pcScan1.voxelHullVoxelSize);

% Plot only selected points
close; pcScan2.plot('Color', 'y');
title('Only points of yellow pc which are overlapping with magenta pc', 'Color', 'w'); view(0,0);
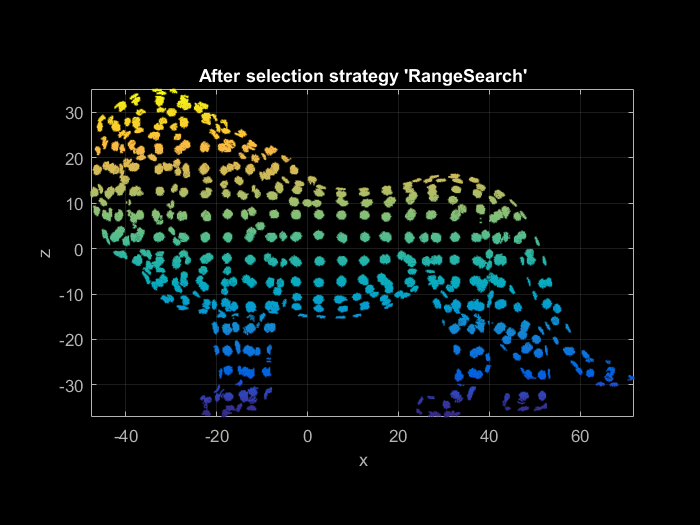
(10) RangeSearch = Selection of points within the range of another point cloud
clc; clear; close all; % clear everything

% Import point cloud
pc = pointCloud('Lion.xyz');

% Plot all points
pc.plot;
title('All Points', 'Color', 'w'); view(0,0); snapnow;

% First select a subset of points with uniform sampling, then search all points within the range of 1 from these points
pc.select('UniformSampling', 5);

points = pc.X(pc.act,:); % save selected points to matrix

pc.select('All'); % reselect all points

searchRadius = 1;
pc.select('RangeSearch', points, searchRadius);

% Plot only selected points
close; pc.plot;
title('After selection strategy ''RangeSearch''', 'Color', 'w'); view(0,0);

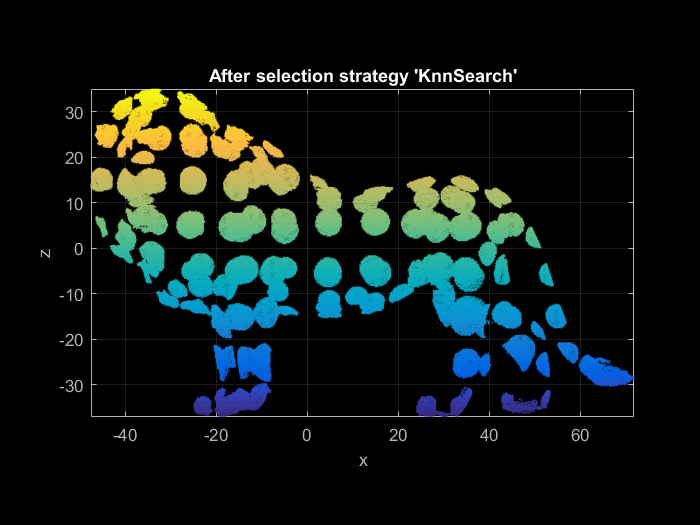
(11) KnnSearch = Selection of K nearest neighbors for each point of another point cloud
clc; clear; close all; % clear everything

% Import point cloud
pc = pointCloud('Lion.xyz');

% Plot all points
pc.plot;
title('All Points', 'Color', 'w'); view(0,0); snapnow;

% First select a subset of points with uniform sampling, then search the 500 nearest neighbors of these points
pc.select('UniformSampling', 10);

points = pc.X(pc.act,:); % save selected points to matrix

pc.select('All'); % reselect all points

pc.select('KnnSearch', points, 'K', 500);

% Plot only selected points
close; pc.plot;
title('After selection strategy ''KnnSearch''', 'Color', 'w'); view(0,0);

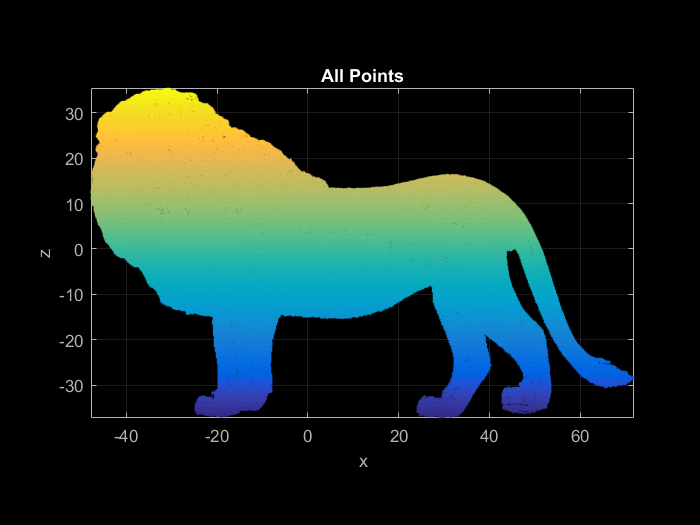
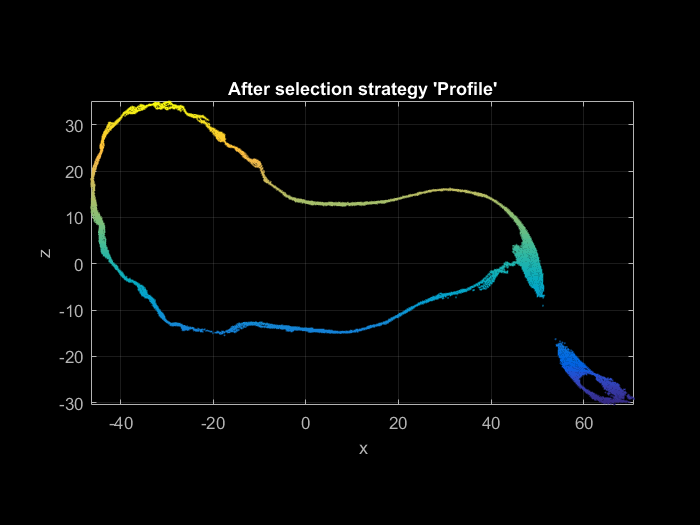
(12) Profile = Selection of points within a vertical profile
clc; clear; close all; % clear everything

% Import point cloud
pc = pointCloud('Lion.xyz');

% Plot all points
pc.plot;
title('All Points', 'Color', 'w'); view(0,0); snapnow;

% Select a crossection
lineStart = [ 100 0];
lineEnd   = [-100 0];
lineWidth = 2;
az = pc.select('Profile', lineStart, lineEnd, lineWidth); % az contains the azimuth of cross section (to use with function view, see below)

% Plot only selected points
close; pc.plot;
title('After selection strategy ''Profile''', 'Color', 'w'); view(az,0);