THIN OUT A HUGE POINT CLOUD WITH THE POINTCLOUD CLASS
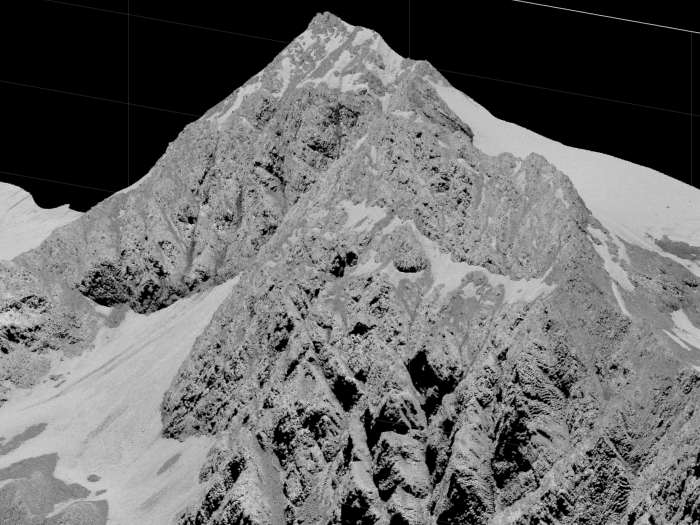
In this tutorial a a huge point cloud (4.5 million points) is filtered with the UniformSampling selection strategy. The point cloud was acquired over the Austrian Alps by Airborne Laserscanning (ALS).
Contents
Note: You can extract the code from this html file with the matlab function grabcode
Import (and plot) point cloud
Note: you have to download the point cloud used within this example from the website.
% Import all 4.5 million points from a laz file
pc = pointCloud('ALS_strip.laz');

% Plot all points of point cloud
pc.plot('Color'       , 'A.intensity', ... % plot intensity of points
        'ColorMapName', 'gray', ...        % use gray colomap
        'MaxPoints'   , Inf, ...           % maximum number of points is set to infinity, this way all points are visualized!
        'MarkerSize'  , 1);                % small points

title('All points', 'Color', 'w');

% Change camera view
h = gca; h.CameraPosition = [617770 5169400 7300]; h.CameraTarget = [635750 5192420 3200]; h.CameraViewAngle = 0.91;
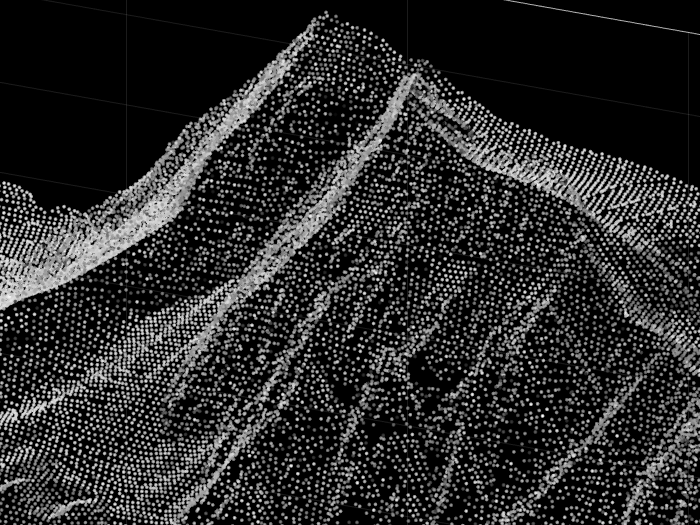
Filter (and plot) point cloud
% Select points with a sampling distance of 10 meter
pc.select('UniformSampling', 10);

% Plot only the selected points
close; % close previous figure
pc.plot('Color'       , 'A.intensity', ...
        'ColorMapName', 'gray', ...
        'MaxPoints'   , Inf, ...
        'MarkerSize'  , 5);

title('Selected points', 'Color', 'w');

% Change camera view
h = gca; h.CameraPosition = [617770 5169400 7300]; h.CameraTarget = [635750 5192420 3200]; h.CameraViewAngle = 0.91;
Export point cloud
% Export the selected points only as ply file (without attributes)
pc.export('ALS_strip_selection.ply');